
Sharing data with charts and maps
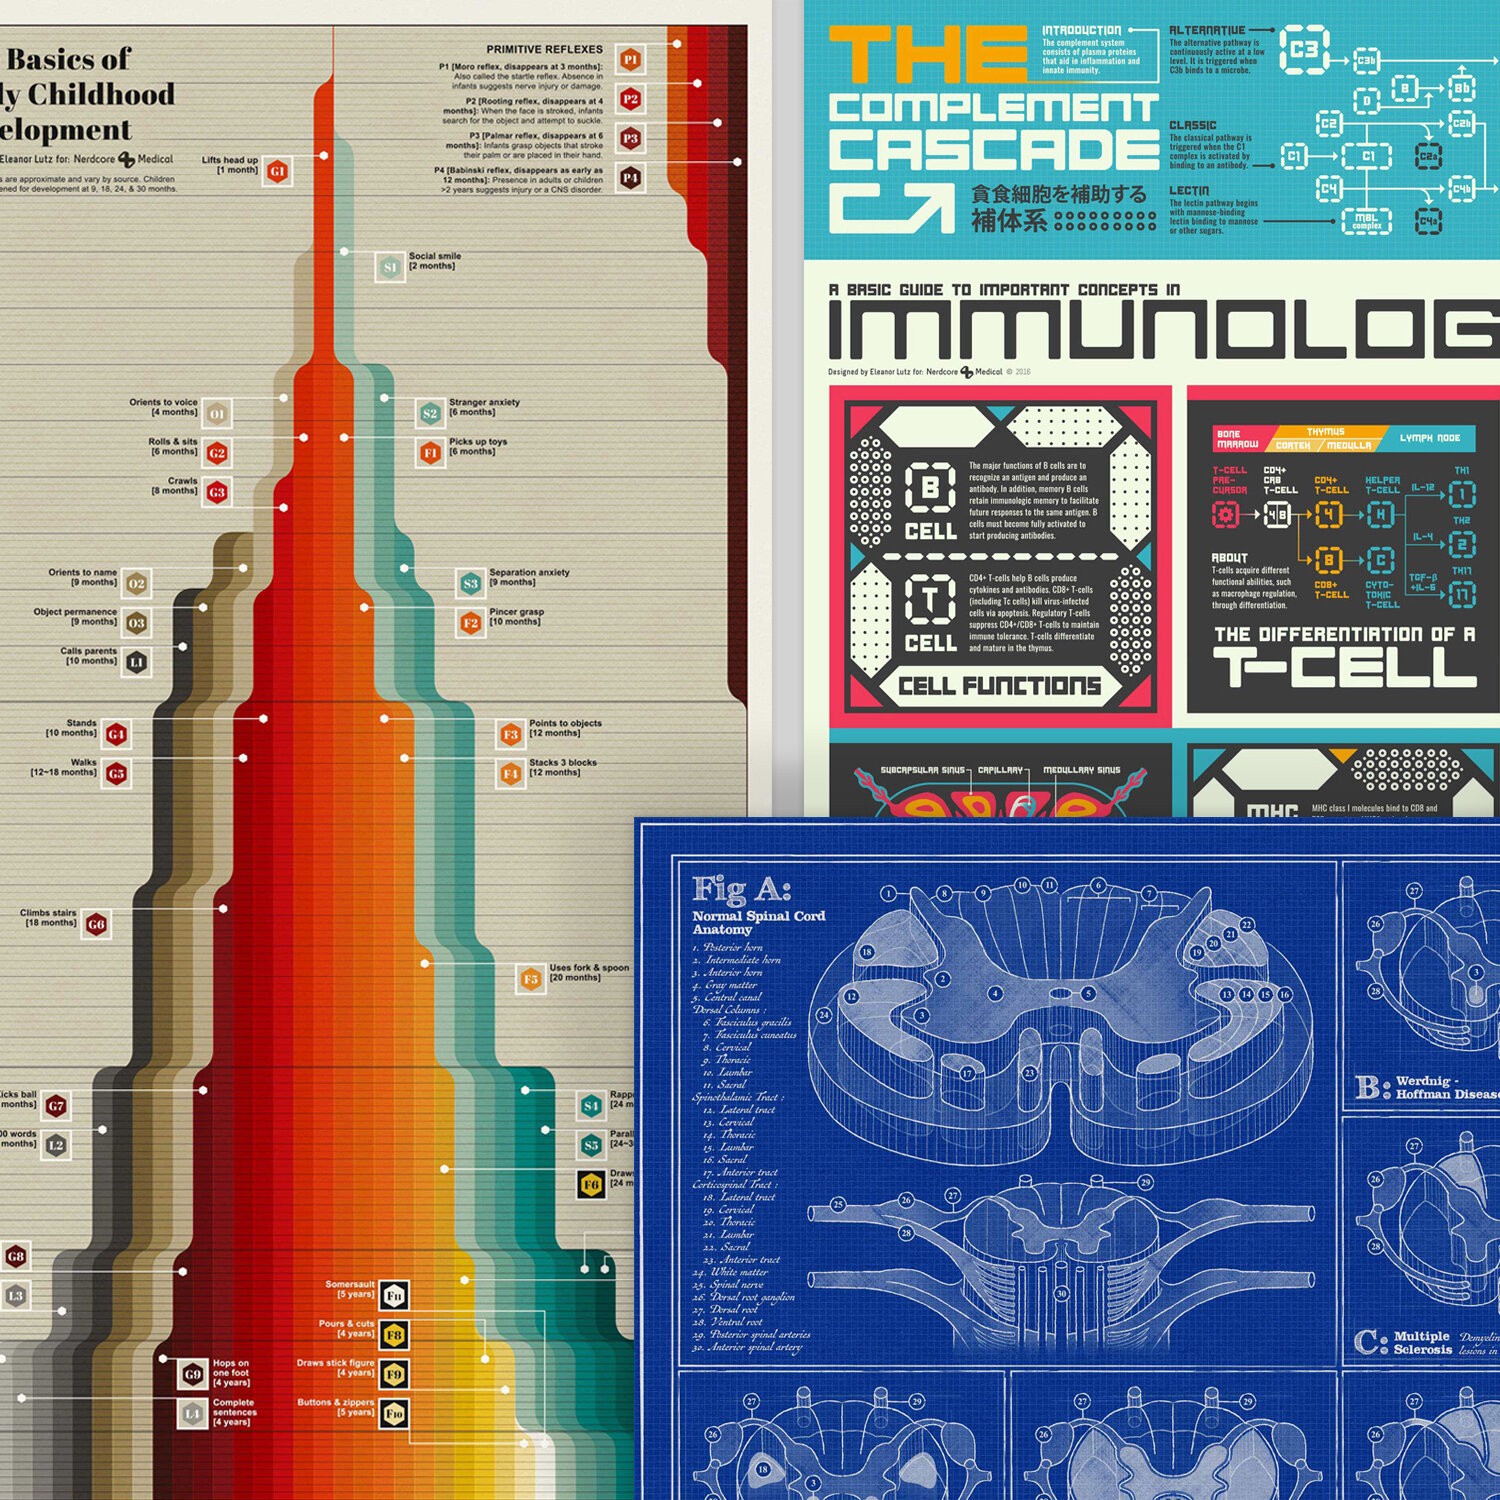
Eleanor Lutz is an information designer who began as a Ph.D. biology student. She now uses many of the skills she learned in graduate school, such as coding and statistics, for her work in science communication.
In this talk, Eleanor will share what her daily life was like while working as a freelance science designer, and now, as a graphics editor at The New York Times. She'll talk about several different kinds of freelance science design work—like working for large textbook companies vs. small businesses—and what you might experience in these different roles. She'll also share how her science background ties into her current work in journalism.
Eleanor will also chat in-depth about a couple of graphic projects she found particularly challenging and explain how she worked through the design process from start to finish.
Date and Time:
Friday, May 14, 2021
2:00 p.m. to 3:00 p.m. ET
(One-hour presentation with question-and-answer session)
Missed the presentation? View the video recording here: https://vimeo.com/552017907/349386890f
The road less travelled–BMC Speakers Series 2021 full program: https://bmc.med.utoronto.ca/news-events/2021/1/31/the-road-less-travelledbmc-speaker-series-2021

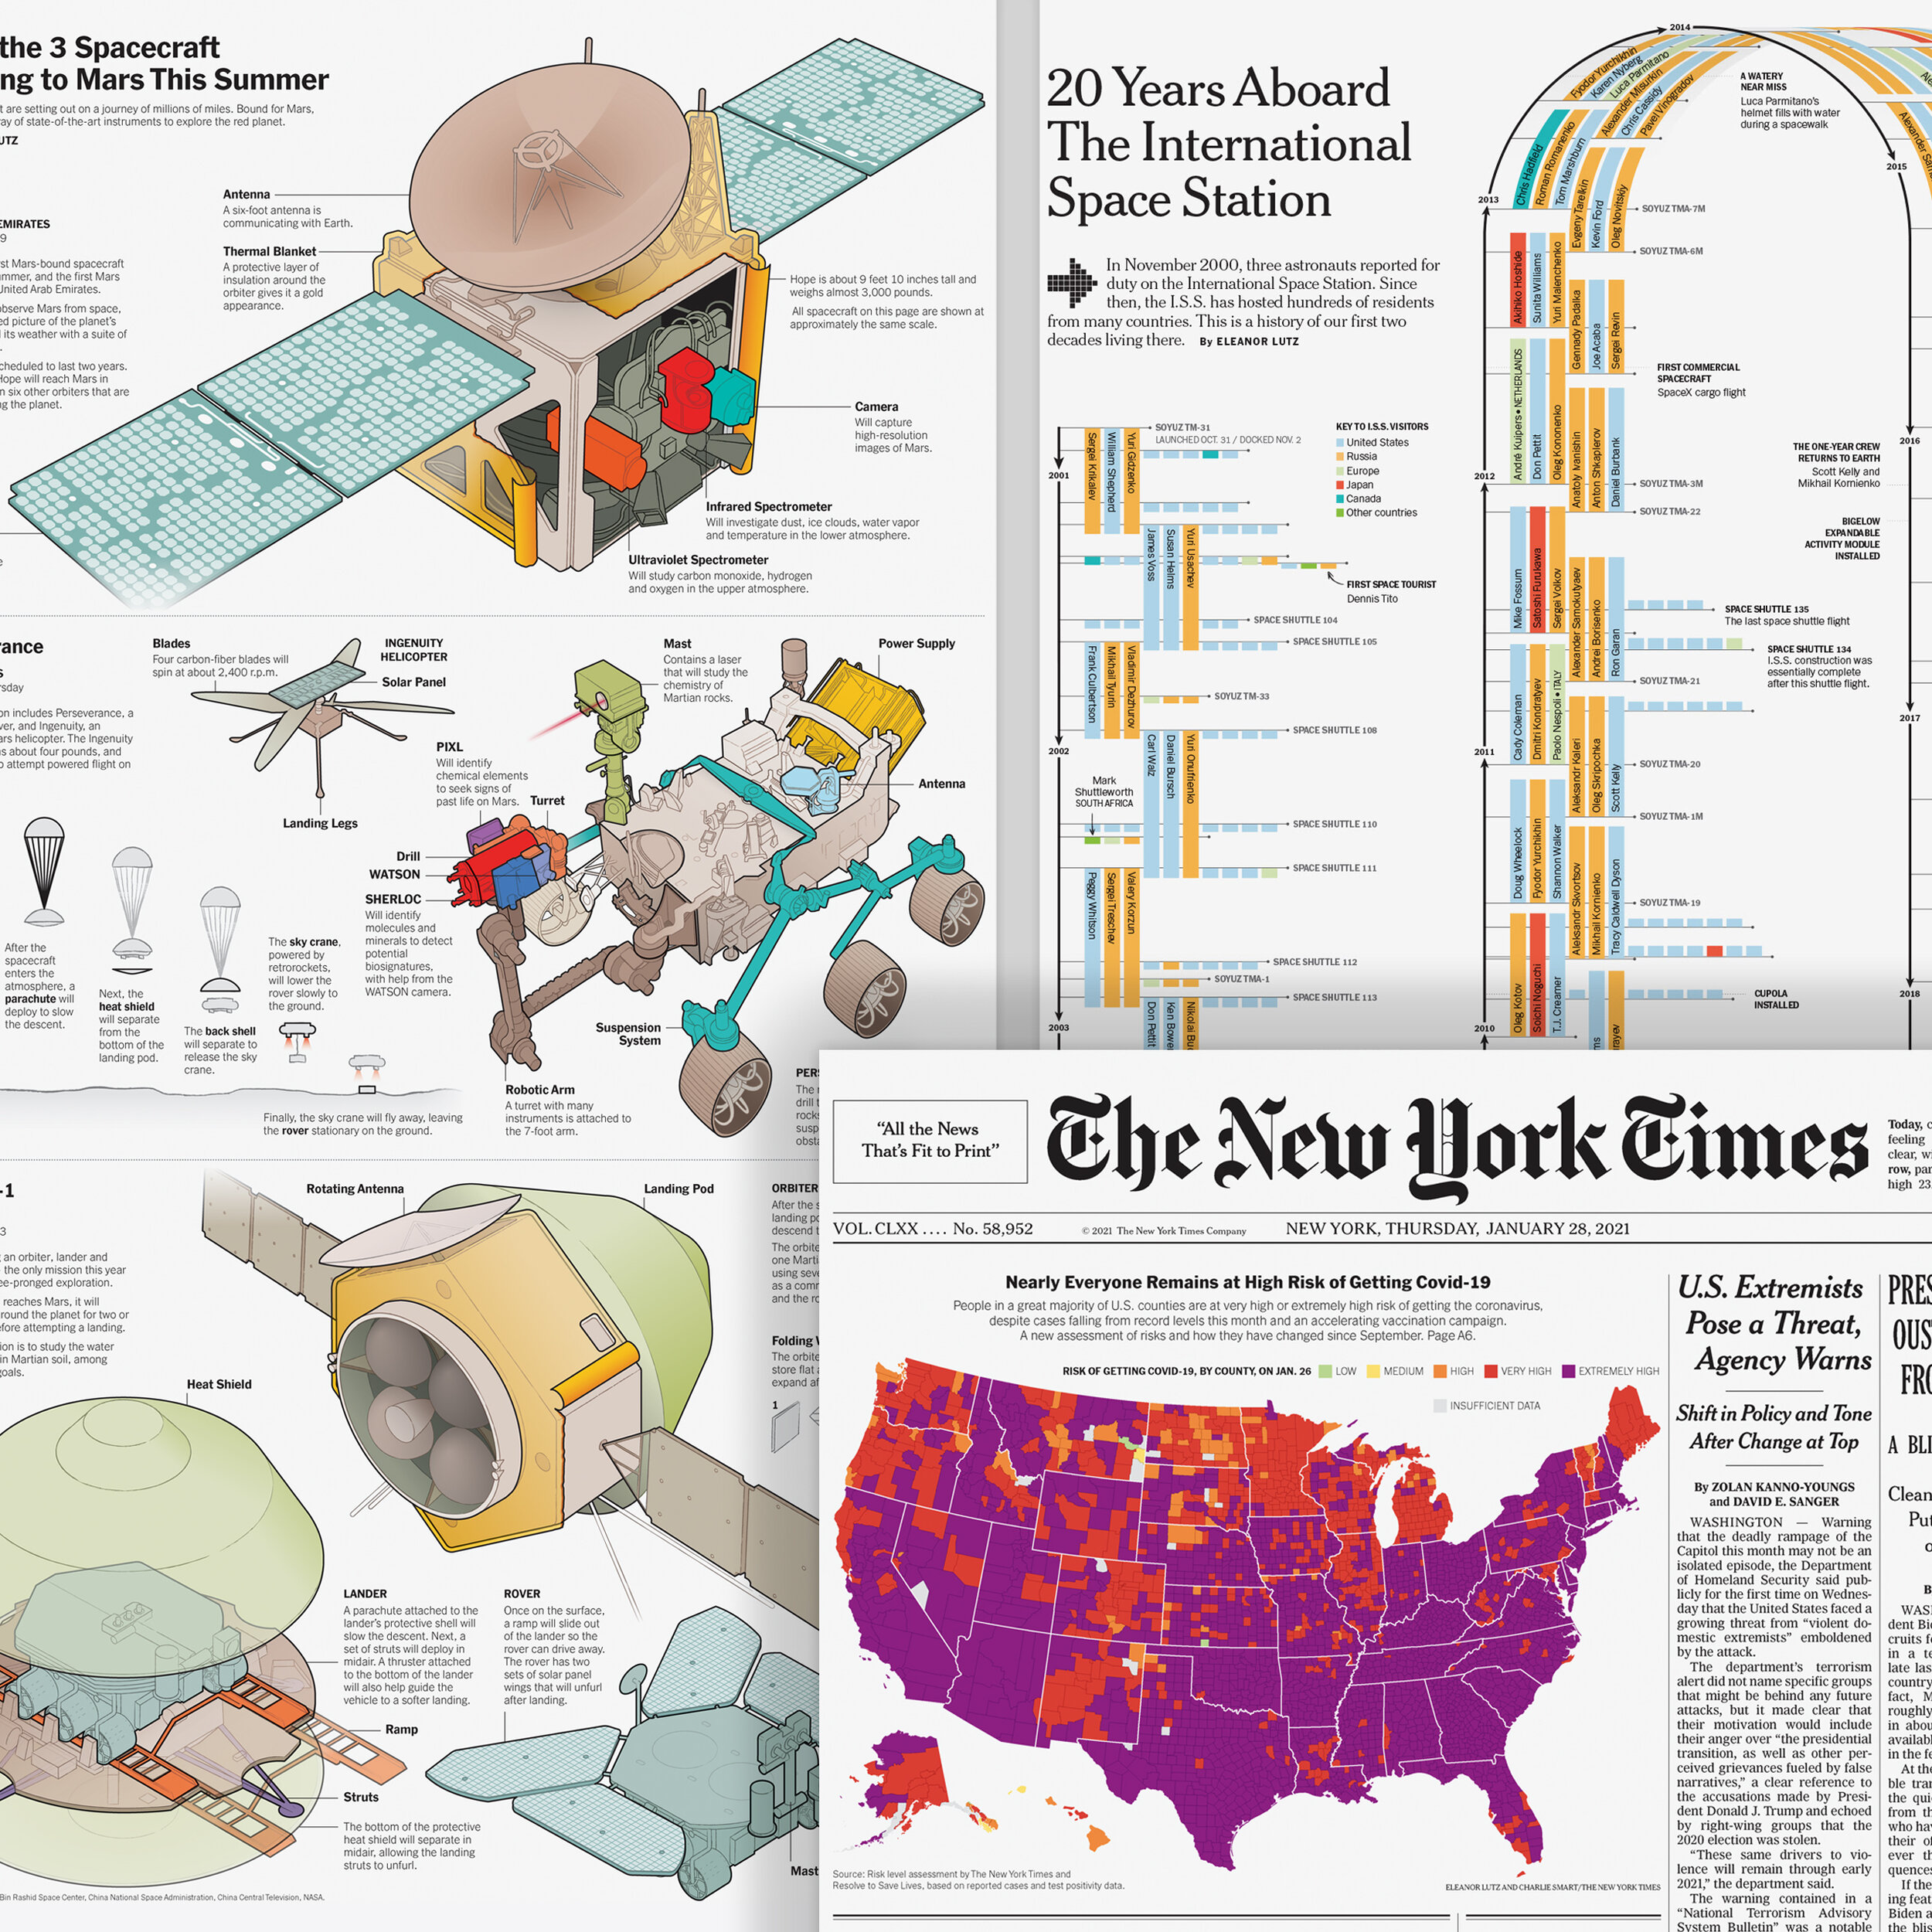
Eleanor is part of the 2020-2021 Fellowship class at The New York Times. She works in the graphics department making charts, maps, and data visualizations. Last year, she worked on coverage of the 2020 election, Donald Trump's taxes, and coronavirus risk levels in counties across the United States. Eleanor completed her Ph.D. at the University of Washington where she studied biology and data science.